Step-by-Step Guide: Calculating Distinct Data Points with Microsoft Excel

Step-by-Step Guide: Calculating Distinct Data Points with Microsoft Excel
Quick Links
You can use the COUNT function and variations to count cells that contain numbers. But what if you want to count only the distinct values in a cell range? We’ll show you two ways to count unique values in Excel.
Both methods we’ll explain use a combination of functions and variations of the COUNT function . And because your cell range could include blank cells, we’re including alternative formulas to account for this.
Related: How to Use the COUNT Function in Microsoft Excel
Use the COUNTA and UNIQUE Functions
This first method is for those who use Excel for Microsoft 365 , Excel for the web, Excel 2021, or Excel for iPhone, iPad, or Android phones or tablets. This is because the UNIQUE function is only available in these and later versions of Excel.
The UNIQUE function provides all distinct values in a cell range. Because you don’t want to list those unique values, but count them instead, you’ll add the COUNTA function. The COUNTA function counts nonblank cells .
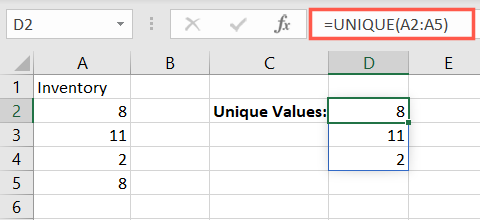
To list the unique values in the cell range A2 through A5, you would use this formula:
=UNIQUE(A2:A5)
You can see here we have three distinct values listed.

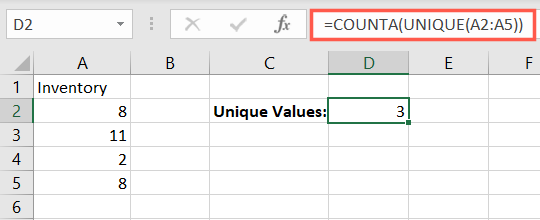
To count those unique values instead of listing them, you add the COUNTA function to the beginning of the formula:
=COUNTA(UNIQUE(A2:A5))
Now you have the count for those unique values which is 3.

If the cell range you want to count contains blanks, those will be included as unique values which may cause a problem. To exclude blank cells in your range, you can add the FILTER function to the formula:
The FILTER function is only available in the versions of Excel listed above .
=COUNTA(UNIQUE(FILTER(A2:A5,A2:A5<>””)))
Let’s break down the FILTER portion of the formula. A2:A5,A2:A5 represents the cell range and the criteria to filter which are the same, <> represents not equal to, and "" represents blank.
As you can see in the screenshot below, the blank cell in our array is not counted as a unique value.

Related: How to Count Cells in Microsoft Excel
Use the SUM and COUNTIF Functions
If you’re using a version of Excel where the UNIQUE and FILTER functions are unavailable, you can use SUM and COUNTIF instead.
You may also use the same formulas below replacing the SUM function with SUMPRODUCT.
The SUM function adds numbers and the COUNTIF function counts those cells containing numbers that meet specific criteria.
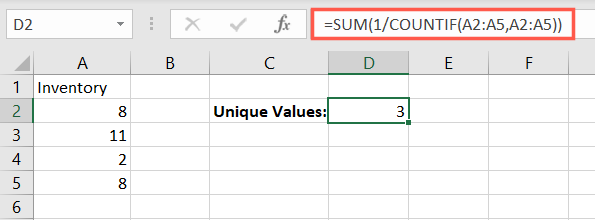
To find the unique values in the cell range A2 through A5, use the following formula:
=SUM(1/COUNTIF(A2:A5,A2:A5))
To break down this formula, the COUNTIF function counts the cells with numbers in our range and uses that same cell range as the criteria. That result then is divided by 1 and the SUM function adds the remaining values.

Similar to the first method, you can run into issues if you have blanks in your cell range with this method. Only, you’ll receive the #DIV/0
To eliminate this problem, you can use the following formula:
=SUM((A2:A5<>””)/COUNTIF(A2:A5,A2:A5&””))
The additional portion for the COUNTIF function concatenates a blank string to prevent zeroes in the results because you cannot divide by zero. The additional portion for the SUM function adds the values that do not equal blank. All of this provides the count of distinct values and also does not count blanks as unique.

Finding unique values in Excel doesn’t have to be a difficult task. By using the functions and formulas here, you should see those distinct values in no time!
Related: Functions vs. Formulas in Microsoft Excel: What’s the Difference?
Also read:
- [New] 2024 Approved The Ultimate Instagram Captioning Hack for Reels and Stories
- 2024 Approved The Ultimate Guide to Design and Build Your Own 4K Editing System
- 4 Easy Ways for Your Xiaomi Redmi Note 12 Pro+ 5G Hard Reset | Dr.fone
- Achieving Ideal Illumination: A Guide to Masterful Video Lighting Techniques
- AMD Ryzen 9X00 Pricing Unveiled by France - Eurozone's Ryzen 9 9900X Listed at Almost €680
- Boost Your System: Proven Methods to Curb Discord's CPU Drainage
- Facebook動画再生苦情を解決する簡単方法
- Forgotten The Voicemail Password Of Motorola Edge 40 Neo? Try These Fixes
- How to Archive Snaps From Android + Mac Systems for 2024
- How to Overcome Cyberpunk 2077'S Notorious Black Screen Problem
- Mastering League of Legends Startup Problems: Effective Solutions for Players - Year 202#
- PC Troubleshooting: Top 5 Fixes for World of Warships Crashes
- Say Goodbye to Blurry Scenes: Outriders' Graphics Upgrade Successful
- The Art of Color Grading Utilizing LUTs in AE
- Troubleshooting Starfield's Audio Glitches - No More Skipping Sounds!
- Troubleshooting Steps: Solving Corsair iCUE Compatibility Issues with Windows 11
- Unlock Smooth Screenshare: Troubleshooting and Solving ShadowPlay on Windows
- Title: Step-by-Step Guide: Calculating Distinct Data Points with Microsoft Excel
- Author: Christopher
- Created at : 2024-12-05 18:50:27
- Updated at : 2024-12-12 18:13:32
- Link: https://win-blog.techidaily.com/step-by-step-guide-calculating-distinct-data-points-with-microsoft-excel/
- License: This work is licensed under CC BY-NC-SA 4.0.